Learning NMR
03/09/23 10:35 Filed in: Learning NMR
While originally a curiosity for theoretical physicists, NMR techniques are now routinely applied to solve problems across chemistry, physics, biology, engineering, medicine and just about everything in between. While in some instances, a ‘turn up and press go’ attitude will give spectra that can be interpreted, a deeper understanding of the theory will dramatically increase both the quality of the data, and the information that can be obtained from your sample.
Learning and understanding NMR is, however, a uniquely challenging prospect. A physicist will describe NMR as a ‘solved problem’ in the sense that the fundamental equations used to describe the phenomena have been well known for over 50 years. Nevertheless, hundreds of novel experiments are still published every year, taking advantage of one subtlety or another. So while NMR is ‘solved’, new and creative ways of exploiting the physics are continually being developed. Students that wish to take maximum advantage of new experiments need an appreciation of the theory.
For those interested in applying NMR to problems in biology, the chemical properties of the system under study must be fully understood. These twin requirements make biomolecular NMR studies hugely cross-disciplinary, and therefore intellectually incredibly rewarding. Though in the words of Lewis Kay, ‘it’s not easy’.
There are a great many textbooks devoted to all aspects of biomolecular NMR. Depending on the background of the student, it is common for students to find the physics either impenetrable, or over-simplified. A good solution is simply to approach the problem from as many different directions as possible and find the one that works.
To help with this, the following are some resources that I have personally found to be incredibly useful for understanding one aspect or another of NMR spectroscopy. I hope they are of use to you. If you think a given resource is either too technical or too hand-wavy, simply switch to another, and work your way up! Good luck.
Most accessible for chemists:
‘Advanced spectroscopy’, and ‘NMR biophysics’ courses by Oliver Zerbe
‘The basics of NMR’ by Joseph Hornak
NMR Lectures by James Keeler
NMR Lecture course by David Case pdf
NMR Lecture by Christian Griesinger pdf
For those interested in a more mathematical treatment:
Lewis Kay’s Lecture Notes (Jan 2010)
(Survival guide for the Kay lab) pdf
NMR notes from Ronald E.D. McClung (1983)
(From group meetings, saved by Ranjith) pdf
NMR Lecture notes on chemical exchange by Pramodh Vallurupalli (Feb 2009) pdf
The three papers that started it all:
Bloch F, Physical Review (1946) 70 460
Wangsness RK, Bloch F, Physical Review (1953) 89 728
Redfield AG, IBM Journal (1957) 19-31
Quick data references
06/09/21 09:08 Filed in: Quick references
A selection of quick ‘go-to’ references for values such as scalar coupling constants in proteins, and chemical shifts
Scalar coupling constants:
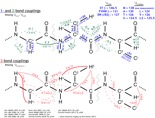
Scalar coupling in amino acids by Dr. Alexandar Hansen png
Chemical Shifts:
BMRB database statistics (protein chemical shifts) here
Chemical shift distribution histograms for proteins, from the BMRB (needs Javascript enabled)
Chemical shift distribution histograms for proteins allowing side-by-side comparison, from the BMRB (needs Javascript enabled)
Biomolecular structure:
PDB statistics
Misc:
Bionumbers - contains a great many random quantities such as cell volume, cellular concentration of ATP etc.
Web of Knowledge, Portal for UofT
Scalar coupling constants:
Scalar coupling in amino acids by Dr. Alexandar Hansen png
Chemical Shifts:
BMRB database statistics (protein chemical shifts) here
Chemical shift distribution histograms for proteins, from the BMRB (needs Javascript enabled)
Chemical shift distribution histograms for proteins allowing side-by-side comparison, from the BMRB (needs Javascript enabled)
Biomolecular structure:
PDB statistics
Misc:
Bionumbers - contains a great many random quantities such as cell volume, cellular concentration of ATP etc.
Web of Knowledge, Portal for UofT